The audiogram is a graph which gives a detailed description of your
hearing ability and which can be described as a picture of your sense of hearing.
Audiogram
Source: www.hear-it.org
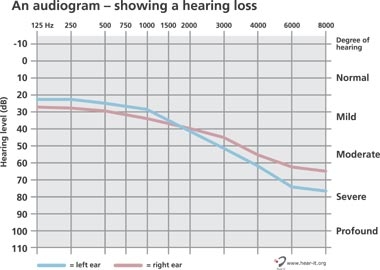
The audiogram illustrates your hearing ability by showing your hearing threshold at various frequencies. Hearing threshold is an indication of how soft a sound may get before it is inaudible. A hearing threshold of between 0 and 25 dB is considered normal.
How to read an audiogram?
The vertical axis of the audiogram represents sound volume or intensity, which is measured in decibels (dB). The more one moves down the axis, the louder the sound becomes. This corresponds to turning up the volume on a radio. Zero decibel at the top of the axis represents the softest sound a person is normally able to hear and is not an indication that you cannot hear any sounds at all.
The horizontal axis of the audiogram represents sound frequency or pitch measured in Hertz (Hz). Sound frequency increases gradually the further one moves to the right along the axis. This movement can be compared to playing on the left side of a piano and gradually moving to the right side where the tone becomes more and more high-pitched. Frequencies between 500 Hz and 3000 Hz are most commonly used during ordinary conversation.
During a hearing test the results are recorded on the audiogram by means of red Os for the right ear and blue Xs for the left one. The resulting red and blue lines show your hearing threshold for each ear, and the results may well differ.
Generally speaking, the more markings below 25 dB or more, at frequencies which are normally used in conversation, the more difficult it is to hear what is being said. And in situations with a lot of background noise it will often be even more difficult to hear properly.
Source: www.hear-it.org